Node.js CPU Profiling 的几种方式
目前有多种方式可以用来获取 Node.js 应用执行过程中的 Profiling 信息。
通过 V8 flag
虽然是 v8 的 flag,但是 Node.js 也可以用。
使用
执行的时候加上
-prof,通过-logfile可以指定输出文件名称。此外还有一个
print_opt_source可以输出优化后的代码(还不知道具体作用,猜测是优化后的代码也可以定位到具体内容。1
node --prof --logfile=%p-v8.log --print_opt_source ./index.js
使用 V8 自带的工具得到汇总结果,必须要有一个可用的 d8,设置
D8_PATH变量。1
tools/linux-tick-processor v8.log
会在命令行得到一个汇总后的报告。例子:https://v8.dev/docs/profile#example-output
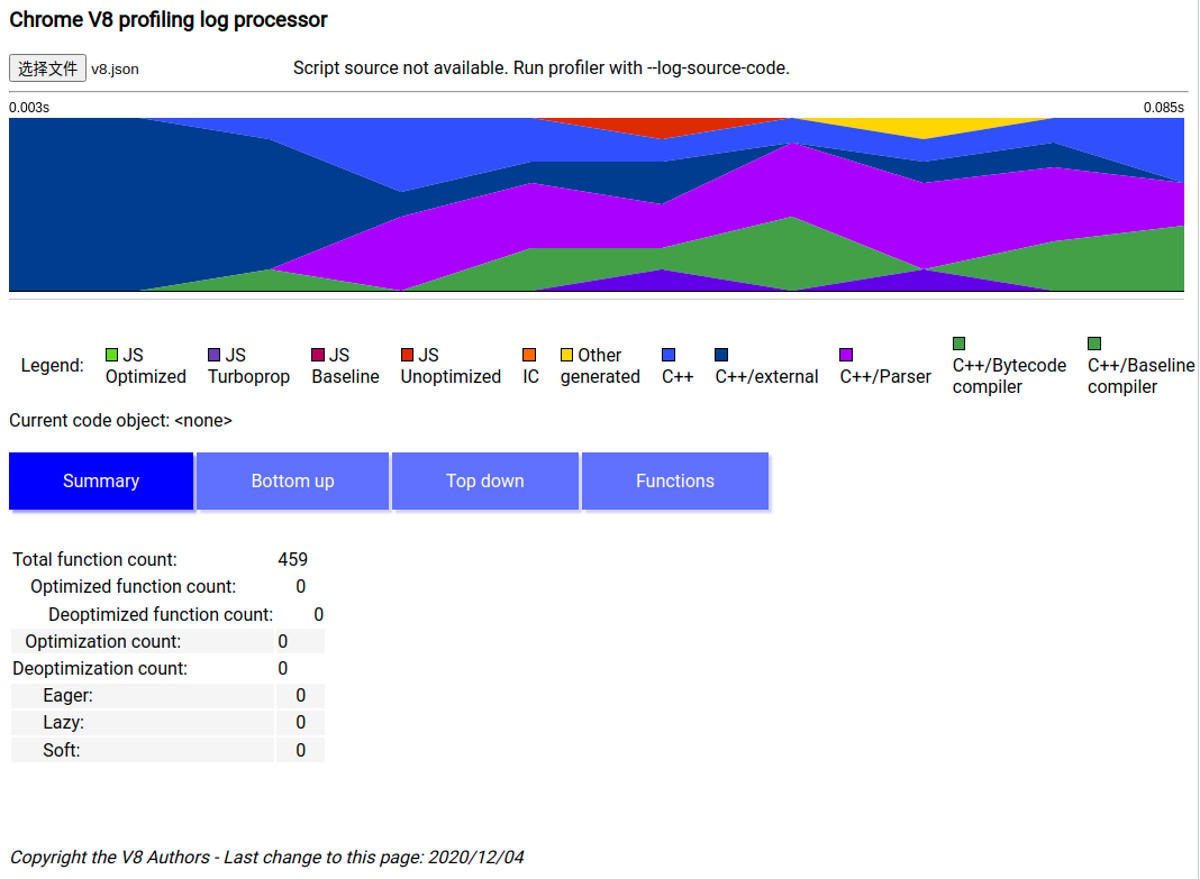
也可以用 V8 提供的工具,预处理结果,之后使用可视化工具来查看。
1
tools/linux-tick-processor --preprocess v8.log > v8.json
v8 代码中有一个 profview:tools/profview/index.html
在线版:https://v8.github.io/tools/head/profview/
v8-profiler-next
https://github.com/hyj1991/v8-profiler-next
在代码内部进行 profiling。
使用
修改代码
1
2
3
4
5
6
7
8
9
10
11
12;
const v8Profiler = require('v8-profiler-next');
const title = 'good-name';
// ex. 5 mins cpu profile
v8Profiler.startProfiling(title, true);
setTimeout(() => {
const profile = v8Profiler.stopProfiling(title);
profile.export(function (error, result) {
fs.writeFileSync(`${title}.cpuprofile`, result);
profile.delete();
});
}, 5 * 60 * 1000);使用 Chrome Devtools 来查看
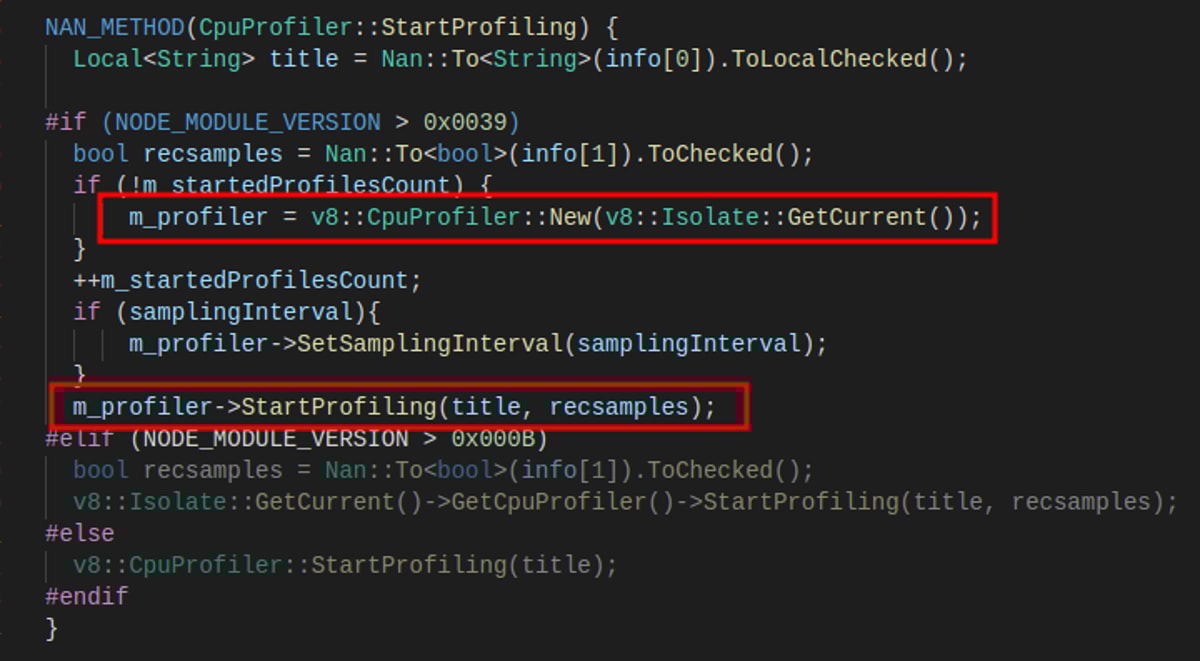
原理
v8::CpuProfiler::StartProfiling: https://v8docs.nodesource.com/node-15.0/d2/d34/classv8_1_1_cpu_profiler.html
0x
https://github.com/davidmarkclements/0x
封装了 --prof 对 v8 的产出做了处理,生成直接可用的火焰图。
使用
1 | 0x my-app.js |
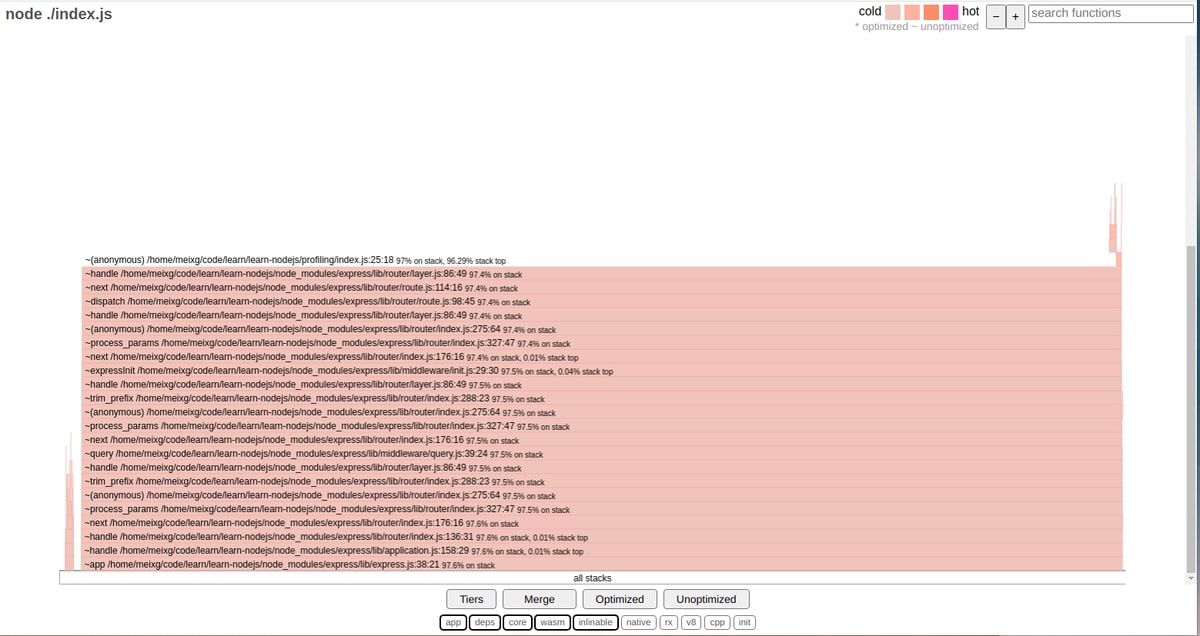
提供了代码优化信息。
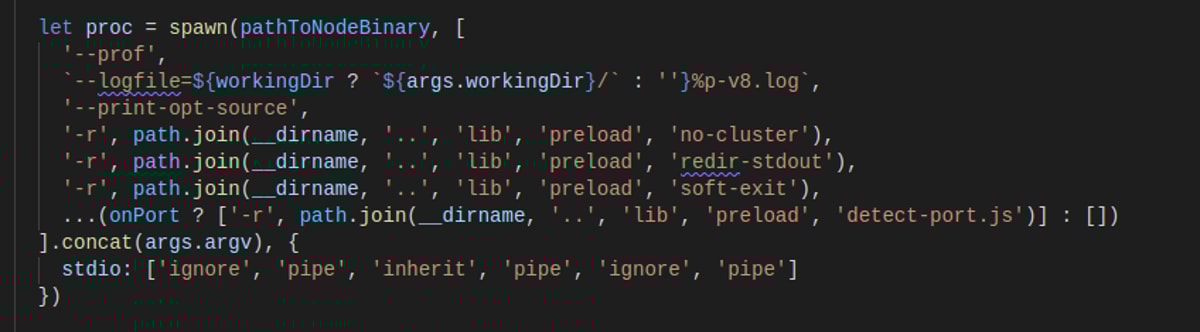
原理
开了一个子进程执行代码,加上了 --prof 等参数,然后对输出结果进行处理。
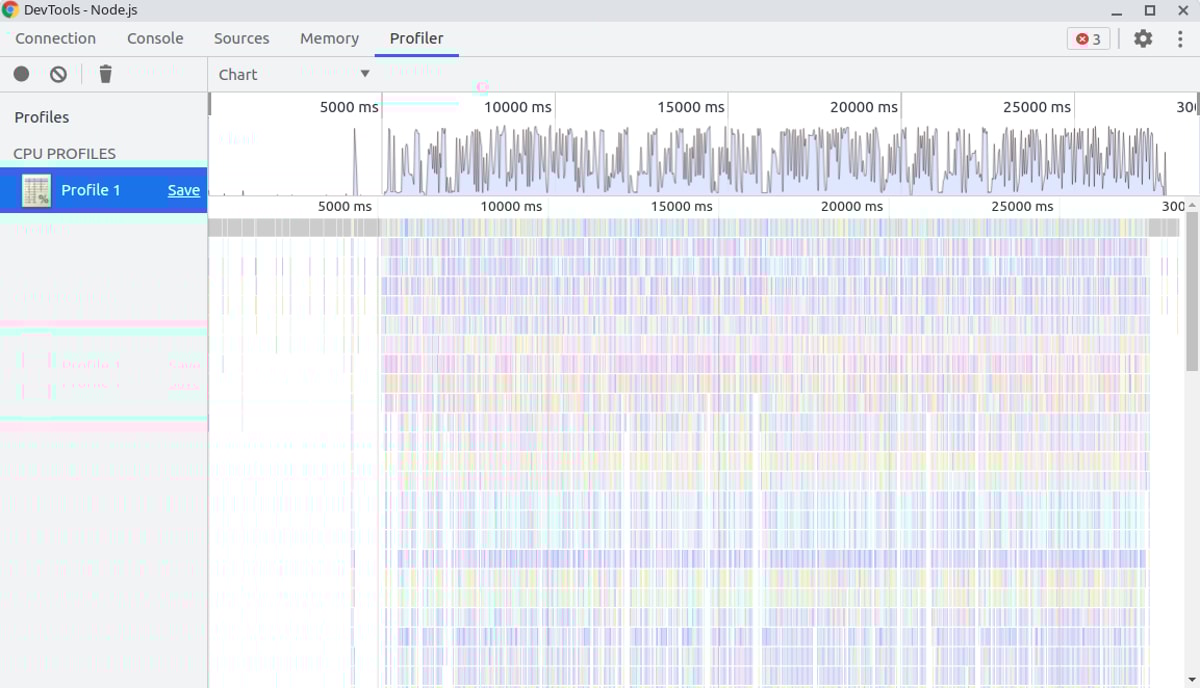
Chrome Devtools inspect 抓取
使用
chrome://inspect/#devices
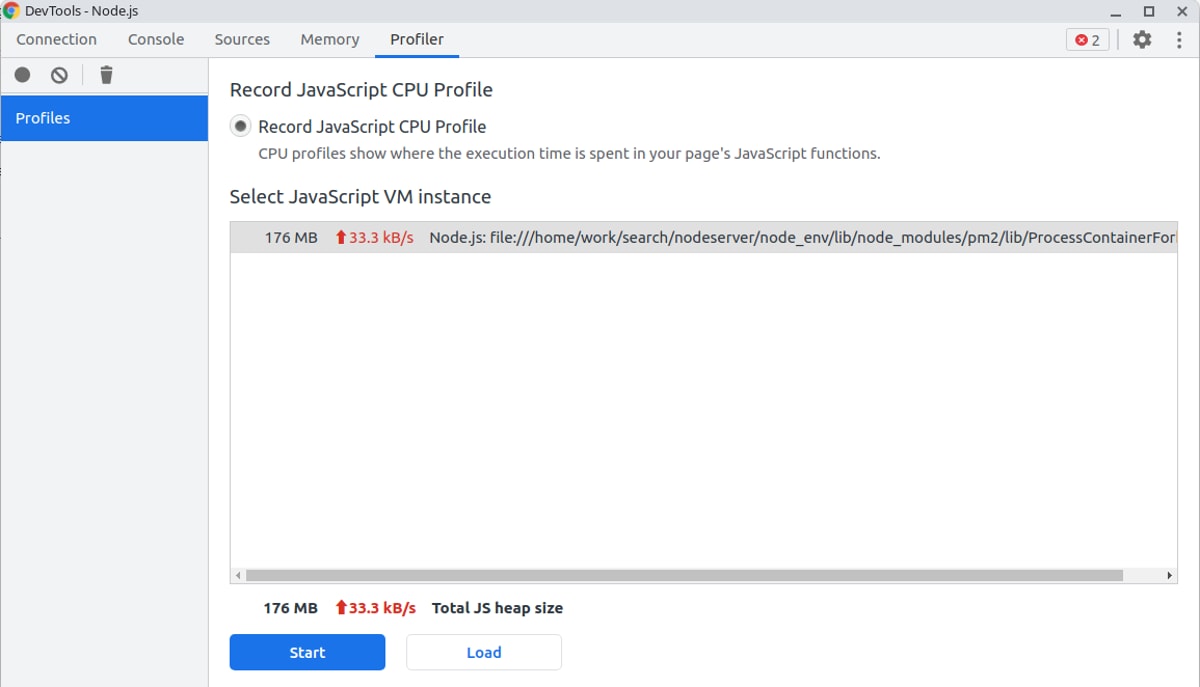
点击 start 开始录制,stop 停止录制,产出结果